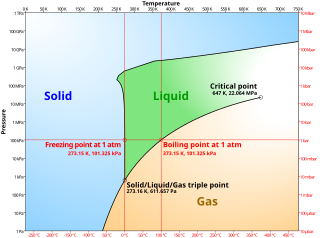
phase diagram
From Wiktionary, the free dictionary
English

Noun
phase diagram (plural phase diagrams)
- (physics, chemistry) A graph, with axes representing temperature and pressure, showing the equilibrium conditions for a given substance to be a solid, liquid or gas.
- a similar diagram for a binary mixture of substances, with axes representing composition and temperature.
Related terms
Translations
graph, with axes representing temperature and pressure, showing the equilibrium conditions for a given substance to be a solid, liquid or gas
|
similar diagram for a binary mixture of substances, with axes representing composition and temperature
|
Further reading
 phase diagram on Wikipedia.Wikipedia
Wikiwand - on
Seamless Wikipedia browsing. On steroids.