Shōbara
City in Chūgoku, Japan From Wikipedia, the free encyclopedia
Shōbara (庄原市, Shōbara-shi) is a city in Hiroshima Prefecture, Japan. As of 31 March 2023[update], the city had an estimated population of 32,343 in 14984 households and a population density of 26 persons per km².[2] The total area of the city is 1,246.49 square kilometres (481.27 sq mi).
Shōbara
庄原市 | |
---|---|
Coordinates: 34°51′16″N 133°01′09″E | |
Country | Japan |
Region | Chūgoku (San'yō) |
Prefecture | Hiroshima |
Government | |
• Mayor | Kozo Kiyama 木山 耕三 (since April 2013)[1] |
Area | |
• Total | 1,246.49 km2 (481.27 sq mi) |
Population (March 31, 2023) | |
• Total | 32,343 |
• Density | 26/km2 (67/sq mi) |
Time zone | UTC+09:00 (JST) |
City hall address | 1-10-1 Nakamoto-chō, Shōbara-shi, Hiroshima-ken 727-8501 |
Climate | Cfa |
Website | Official website |
Symbols | |
Flower | Sakura |
Tree | Siebold's beech |
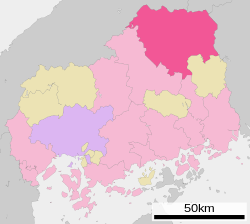
Shōbara is located in the Chugoku Mountains in the northeast corner of Hiroshima Prefecture.
Shōbara has a humid subtropical climate (Köppen climate classification Cfa) characterized by cool to mild winters and hot, humid summers. The average annual temperature in Shōbara is 12.7 °C (54.9 °F). The average annual rainfall is 1,488.8 mm (58.61 in) with July as the wettest month. The temperatures are highest on average in August, at around 25.0 °C (77.0 °F), and lowest in January, at around 1.0 °C (33.8 °F).[3] The highest temperature ever recorded in Shōbara was 38.1 °C (100.6 °F) on 5 August 2021; the coldest temperature ever recorded was −18.5 °C (−1.3 °F) on 26 February 1991.[4]
Climate data for Shōbara (1991−2020 normals, extremes 1976−present) | |||||||||||||
---|---|---|---|---|---|---|---|---|---|---|---|---|---|
Month | Jan | Feb | Mar | Apr | May | Jun | Jul | Aug | Sep | Oct | Nov | Dec | Year |
Record high °C (°F) | 15.6 (60.1) |
21.4 (70.5) |
24.7 (76.5) |
30.4 (86.7) |
32.8 (91.0) |
34.6 (94.3) |
37.1 (98.8) |
38.1 (100.6) |
35.8 (96.4) |
30.0 (86.0) |
25.5 (77.9) |
18.4 (65.1) |
38.1 (100.6) |
Mean daily maximum °C (°F) | 6.0 (42.8) |
7.8 (46.0) |
12.6 (54.7) |
19.1 (66.4) |
23.7 (74.7) |
26.3 (79.3) |
29.7 (85.5) |
31.2 (88.2) |
26.8 (80.2) |
21.0 (69.8) |
14.8 (58.6) |
8.3 (46.9) |
18.9 (66.1) |
Daily mean °C (°F) | 1.0 (33.8) |
2.0 (35.6) |
5.6 (42.1) |
11.4 (52.5) |
16.4 (61.5) |
20.3 (68.5) |
24.2 (75.6) |
25.0 (77.0) |
20.6 (69.1) |
14.2 (57.6) |
8.2 (46.8) |
3.0 (37.4) |
12.7 (54.8) |
Mean daily minimum °C (°F) | −2.6 (27.3) |
−2.5 (27.5) |
−0.2 (31.6) |
4.4 (39.9) |
9.8 (49.6) |
15.4 (59.7) |
20.2 (68.4) |
20.7 (69.3) |
16.1 (61.0) |
9.2 (48.6) |
3.3 (37.9) |
−0.8 (30.6) |
7.8 (46.0) |
Record low °C (°F) | −11.7 (10.9) |
−13.8 (7.2) |
−8.5 (16.7) |
−4.8 (23.4) |
−1.5 (29.3) |
5.1 (41.2) |
9.1 (48.4) |
12.4 (54.3) |
3.5 (38.3) |
−1.0 (30.2) |
−4.2 (24.4) |
−10.1 (13.8) |
−13.8 (7.2) |
Average precipitation mm (inches) | 71.2 (2.80) |
71.9 (2.83) |
101.4 (3.99) |
105.5 (4.15) |
140.5 (5.53) |
187.5 (7.38) |
249.9 (9.84) |
147.6 (5.81) |
164.8 (6.49) |
96.2 (3.79) |
68.9 (2.71) |
83.6 (3.29) |
1,488.8 (58.61) |
Average precipitation days (≥ 1.0 mm) | 12.5 | 11.2 | 11.6 | 9.9 | 10.0 | 11.7 | 12.5 | 9.9 | 10.1 | 7.9 | 8.9 | 12.7 | 128.9 |
Mean monthly sunshine hours | 89.2 | 106.1 | 154.8 | 181.4 | 196.0 | 139.8 | 147.1 | 180.8 | 143.7 | 153.3 | 124.9 | 93.5 | 1,718.9 |
Source: Japan Meteorological Agency[3][4] |
Climate data for Takano, Shōbara (1991−2020 normals, extremes 1978−present) | |||||||||||||
---|---|---|---|---|---|---|---|---|---|---|---|---|---|
Month | Jan | Feb | Mar | Apr | May | Jun | Jul | Aug | Sep | Oct | Nov | Dec | Year |
Record high °C (°F) | 13.0 (55.4) |
18.4 (65.1) |
22.2 (72.0) |
27.8 (82.0) |
30.5 (86.9) |
32.2 (90.0) |
34.0 (93.2) |
34.5 (94.1) |
32.1 (89.8) |
27.7 (81.9) |
23.6 (74.5) |
17.6 (63.7) |
34.5 (94.1) |
Mean daily maximum °C (°F) | 3.4 (38.1) |
4.7 (40.5) |
9.4 (48.9) |
16.3 (61.3) |
21.2 (70.2) |
24.0 (75.2) |
27.3 (81.1) |
28.6 (83.5) |
24.2 (75.6) |
18.7 (65.7) |
12.8 (55.0) |
6.3 (43.3) |
16.4 (61.5) |
Daily mean °C (°F) | −0.5 (31.1) |
−0.1 (31.8) |
3.5 (38.3) |
9.3 (48.7) |
14.5 (58.1) |
18.5 (65.3) |
22.5 (72.5) |
23.1 (73.6) |
18.8 (65.8) |
12.5 (54.5) |
6.9 (44.4) |
1.7 (35.1) |
10.9 (51.6) |
Mean daily minimum °C (°F) | −4.4 (24.1) |
−4.7 (23.5) |
−2.1 (28.2) |
2.3 (36.1) |
7.8 (46.0) |
13.6 (56.5) |
18.6 (65.5) |
18.9 (66.0) |
14.3 (57.7) |
7.2 (45.0) |
1.7 (35.1) |
−2.2 (28.0) |
5.9 (42.6) |
Record low °C (°F) | −17.0 (1.4) |
−18.5 (−1.3) |
−14.9 (5.2) |
−8.5 (16.7) |
−3.6 (25.5) |
2.4 (36.3) |
5.3 (41.5) |
8.9 (48.0) |
0.1 (32.2) |
−3.2 (26.2) |
−6.4 (20.5) |
−15.4 (4.3) |
−18.5 (−1.3) |
Average precipitation mm (inches) | 147.9 (5.82) |
128.0 (5.04) |
150.9 (5.94) |
134.4 (5.29) |
156.9 (6.18) |
211.3 (8.32) |
294.5 (11.59) |
170.1 (6.70) |
189.6 (7.46) |
125.9 (4.96) |
104.5 (4.11) |
158.0 (6.22) |
1,969.4 (77.54) |
Average snowfall cm (inches) | 208 (82) |
163 (64) |
77 (30) |
3 (1.2) |
0 (0) |
0 (0) |
0 (0) |
0 (0) |
0 (0) |
0 (0) |
6 (2.4) |
118 (46) |
578 (228) |
Average precipitation days (≥ 1.0 mm) | 19.0 | 16.1 | 14.8 | 11.5 | 10.6 | 12.6 | 13.5 | 11.3 | 11.6 | 9.7 | 12.3 | 17.9 | 160.9 |
Average snowy days (≥ 3 cm) | 16.2 | 14.5 | 8.5 | 0.3 | 0 | 0 | 0 | 0 | 0 | 0 | 0.5 | 9.1 | 49.1 |
Mean monthly sunshine hours | 51.3 | 66.3 | 128.4 | 178.1 | 196.7 | 140.5 | 134.1 | 160.3 | 128.2 | 143.7 | 108.3 | 69.7 | 1,504.1 |
Source: Japan Meteorological Agency[5][6] |
Per Japanese census data, the population of Shōbara in 2020 is 33,633 people.[7] Shōbara has been conducting censuses since 1920.
Year | Pop. | ±% |
---|---|---|
1950 | 90,957 | — |
1955 | 88,748 | −2.4% |
1960 | 81,162 | −8.5% |
1965 | 67,983 | −16.2% |
1970 | 60,072 | −11.6% |
1975 | 56,336 | −6.2% |
1980 | 53,506 | −5.0% |
1985 | 52,157 | −2.5% |
1990 | 50,624 | −2.9% |
1995 | 48,539 | −4.1% |
2000 | 45,678 | −5.9% |
2005 | 43,149 | −5.5% |
2010 | 40,255 | −6.7% |
2015 | 37,000 | −8.1% |
2020 | 33,633 | −9.1% |
Shōbara population statistics[7] |
The Shōbara area is part of ancient Bingo Province. During the Edo Period, it was part of the holdings of Hiroshima Domain. Following the Meiji restoration, the village of Shōbara was established within Mikami District, Hiroshima with the creation of the modern municipalities system on April 1, 1889. Mikami District became part of Hiba District, Hiroshima on October 1, 1898 at which time Shōbara was raised to town status. On March 31, 1954 Shōbara merged with the villages of Takamura, Honda, Shikinobu, Yamauchi-Higashi, Yamauchi-Nishi, and Yamauchi-Kita and was raised to city status.
On March 31, 2005, the towns of Hiwa, Kuchiwa, Saijō, Takano, and Tōjō (all from Hiba District), and the town of Sōryō (from Kōnu District) were merged into Shōbara. Hiba District and Kōnu District were both dissolved as a result of this merger.
Shōbara has a mayor-council form of government with a directly elected mayor and a unicameral city council of 20 members. Shōbara contributes one member to the Hiroshima Prefectural Assembly. In terms of national politics, the city is part of the Hiroshima 5th district of the lower house of the Diet of Japan.
The main economic activities in Shōbara are agriculture, mining (kaolinite, limestone) and hydroelectric power generation.
Shōbara has 18 public elementary schools, and seven public junior high schools operated by the city government, and five public high school operated by the Hiroshima Prefectural Board of Education. The prefecture also operates one special education school for the disabled and one agricultural college. The Prefectural University of Hiroshima has a campus in Shōbara.
JR West (JR West) - Geibi Line
JR West (JR West) - Kisuki Line
Seamless Wikipedia browsing. On steroids.
Every time you click a link to Wikipedia, Wiktionary or Wikiquote in your browser's search results, it will show the modern Wikiwand interface.
Wikiwand extension is a five stars, simple, with minimum permission required to keep your browsing private, safe and transparent.