Loading AI tools
Gallatin County, Montana
County in Montana, United States From Wikipedia, the free encyclopedia
Gallatin County is a county located in the U.S. state of Montana. With its county seat in Bozeman, it is the second-most populous county in Montana, with a population of 118,960 in the 2020 Census.[1]
Gallatin County | |
|---|---|
 Gallatin County Courthouse in Bozeman | |
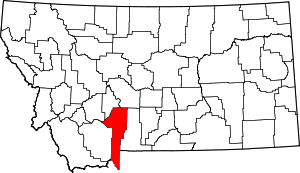
 Location within the U.S. state of Montana | |
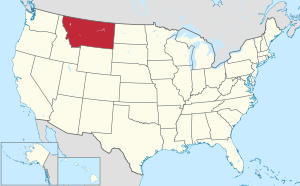
 Montana's location within the U.S. | |
| Coordinates: 45°34′N 111°10′W | |
| Country | |
| State | |
| Founded | 1865 |
| Named for | Gallatin River (Albert Gallatin) |
| Seat | Bozeman |
| Largest city | Bozeman |
| Area | |
• Total | 2,632 sq mi (6,820 km2) |
| • Land | 2,603 sq mi (6,740 km2) |
| • Water | 29 sq mi (80 km2) 1.1% |
| Population (2020) | |
• Total | 118,960 |
• Estimate (2022) | 124,938 |
| • Density | 45/sq mi (17/km2) |
| Time zone | UTC−7 (Mountain) |
| • Summer (DST) | UTC−6 (MDT) |
| Congressional district | 1st |
| Website | www |
| |
The county's prominent geographical features are the Bridger mountains in the north, and the Gallatin mountains and Gallatin River in the south, named by Meriwether Lewis in 1805 for Albert Gallatin,[2] the United States Treasury Secretary who formulated the Lewis and Clark Expedition.
At the southern end of the county, West Yellowstone's entrance into Yellowstone National Park accounts for around half of all park visitors. Big Sky Resort, one of the largest ski resorts in the United States, lies in Gallatin and neighboring Madison counties, midway between Bozeman and West Yellowstone.
During the territorial era, a small patch of land known as "Lost Dakota" existed as a remote exclave of Dakota Territory until it was transferred to Gallatin County, Montana Territory, in 1873.[3]
According to the United States Census Bureau, the county has a total area of 2,632 square miles (6,820 km2), of which 2,603 square miles (6,740 km2) is land and 29 square miles (75 km2) (1.1%) is water.[4] The county attained its present boundaries in 1978, when the former Yellowstone National Park (part) county-equivalent was dissolved and apportioned between Gallatin County and Park County. Gallatin County received 99.155 square miles (256.8 km2) of land area and 0.119 square miles (0.3 km2) of water area, whereas Park County received 146.229 square miles (378.7 km2) of land area and 0.608 square miles (1.6 km2) of water area. The geographies transferred are known now as Census Tract 14 in Gallatin County, and as Census Tract 6 in Park County.
| Census | Pop. | Note | %± |
|---|---|---|---|
| 1870 | 1,578 | — | |
| 1880 | 3,643 | 130.9% | |
| 1890 | 6,246 | 71.5% | |
| 1900 | 9,553 | 52.9% | |
| 1910 | 14,079 | 47.4% | |
| 1920 | 15,864 | 12.7% | |
| 1930 | 16,124 | 1.6% | |
| 1940 | 18,269 | 13.3% | |
| 1950 | 21,902 | 19.9% | |
| 1960 | 26,045 | 18.9% | |
| 1970 | 32,505 | 24.8% | |
| 1980 | 42,865 | 31.9% | |
| 1990 | 50,463 | 17.7% | |
| 2000 | 67,831 | 34.4% | |
| 2010 | 89,513 | 32.0% | |
| 2020 | 118,960 | 32.9% | |
| 2022 (est.) | 124,938 | [5] | 5.0% |
| U.S. Decennial Census[6] 1790–1960,[7] 1900–1990,[8] 1990–2000,[9] 2010–2020[1] | |||
As of the 2020 census, there were 118,960 people and 46,990 households living in the county.[10] The population density was 45.2 inhabitants per square mile (17.5/km2). There were 52,835 housing units in the county at an average density of 20.1 per square mile (7.8/km2).[10] The racial make of the county was 89.0% White, 1.2% Asian, 0.9% American Indian, 0.4% Black of African American, 0.1% Pacific Islander, 1.8% from other races, and 6.6% from two or more races. Those of Hispanic of Latino origin made up 5.0% of the population.[11] In terms of ancestry, 25.4% were German, 14.8% were Irish, 12.4% were English, 8.8% were Norwegian, 4.6% were Italian, 4.0% were French, 3.5% were Scottish, 2.2% were Polish and 0.3% were Subsaharan African.[10]
Of the 46,990 households, 48.2% were a Married-couple family household, 23.9% were a "Male householder, no spouse present, family household", and 20.4% were a "Female householder, no spouse present, family household". The averager family size was 2.96 in the county. The median age was 33.1 years old, compared with 40.1 in Montana.[10]
The median income for a household in the county was $75,418 in the county, significantly higher than the $57,153 median household income in all of Montana. 11.9% of the population was below the poverty line, including 6.9% of those under 18 and 6.5% of those over 65.
As of the 2010 census, there were 89,513 people, 36,550 households, and 21,263 families living in the county. The population density was 34.4 inhabitants per square mile (13.3/km2). There were 42,289 housing units at an average density of 16.2 per square mile (6.3/km2). The racial makeup of the county was 95.1% White, 1.1% Asian, 0.9% American Indian, 0.3% Black or African American, 0.1% Pacific Islander, 0.7% from other races, and 1.9% from two or more races. Those of Hispanic or Latino origin made up 2.8% of the population. In terms of ancestry, 32.2% were German, 18.1% were Irish, 14.7% were English, 9.4% were Norwegian, and 3.5% were American.
Of the 36,550 households, 27.8% had children under the age of 18 living with them, 47.8% were married couples living together, 6.6% had a female householder with no husband present, 41.8% were non-families, and 27.3% of all households were made up of individuals. The average household size was 2.36 and the average family size was 2.90. The median age was 32.5 years.
The median income for a household in the county was $50,136 and the median income for a family was $65,029. Males had a median income of $42,245 versus $31,349 for females. The per capita income for the county was $27,423. About 7.4% of families and 13.5% of the population were below the poverty line, including 12.5% of those under age 18 and 8.2% of those age 65 or over.
Gallatin County has traditionally favored Republican presidential candidates, often by large margins. Recent changes to Gallatin County's demographics (including migration from Democratic-leaning areas,[12] and younger voters adopting more liberal political positions)[13] have made the county more competitive.
Gallatin County is home to the flagship campus of Montana State University, which contributes to its Democratic lean.
Democratic candidates Barack Obama and Hillary Clinton narrowly won Gallatin County in 2008 and 2016 respectively, with Republican Mitt Romney winning in 2012. 2020 Democratic candidate Joe Biden won Gallatin County by the largest margin for a Democrat since Franklin Delano Roosevelt's victory in 1940.
| Year | Republican | Democratic | Third party(ies) | |||
|---|---|---|---|---|---|---|
| No. | % | No. | % | No. | % | |
| 2024 | 32,695 | 46.50% | 34,938 | 49.69% | 2,684 | 3.82% |
| 2020 | 31,696 | 44.33% | 37,044 | 51.80% | 2,767 | 3.87% |
| 2016 | 23,802 | 44.23% | 24,246 | 45.05% | 5,771 | 10.72% |
| 2012 | 24,358 | 50.84% | 21,961 | 45.84% | 1,589 | 3.32% |
| 2008 | 22,578 | 46.77% | 24,205 | 50.14% | 1,489 | 3.08% |
| 2004 | 22,392 | 56.20% | 16,405 | 41.18% | 1,045 | 2.62% |
| 2000 | 18,833 | 58.78% | 10,009 | 31.24% | 3,198 | 9.98% |
| 1996 | 14,559 | 50.07% | 10,972 | 37.73% | 3,547 | 12.20% |
| 1992 | 11,109 | 38.60% | 9,535 | 33.13% | 8,135 | 28.27% |
| 1988 | 13,214 | 56.94% | 9,527 | 41.06% | 464 | 2.00% |
| 1984 | 15,643 | 64.80% | 8,163 | 33.82% | 334 | 1.38% |
| 1980 | 12,738 | 58.63% | 5,747 | 26.45% | 3,241 | 14.92% |
| 1976 | 11,062 | 63.36% | 6,215 | 35.60% | 183 | 1.05% |
| 1972 | 10,663 | 66.28% | 5,096 | 31.68% | 329 | 2.05% |
| 1968 | 7,433 | 62.06% | 3,818 | 31.88% | 727 | 6.07% |
| 1964 | 5,621 | 49.97% | 5,600 | 49.79% | 27 | 0.24% |
| 1960 | 6,870 | 64.49% | 3,761 | 35.31% | 21 | 0.20% |
| 1956 | 6,680 | 67.20% | 3,260 | 32.80% | 0 | 0.00% |
| 1952 | 6,998 | 71.93% | 2,697 | 27.72% | 34 | 0.35% |
| 1948 | 4,220 | 53.08% | 3,548 | 44.63% | 182 | 2.29% |
| 1944 | 3,120 | 47.04% | 3,479 | 52.46% | 33 | 0.50% |
| 1940 | 3,430 | 41.84% | 4,718 | 57.55% | 50 | 0.61% |
| 1936 | 2,151 | 30.01% | 4,697 | 65.53% | 320 | 4.46% |
| 1932 | 2,553 | 35.98% | 4,359 | 61.44% | 183 | 2.58% |
| 1928 | 3,861 | 61.11% | 2,423 | 38.35% | 34 | 0.54% |
| 1924 | 2,494 | 44.35% | 1,564 | 27.81% | 1,565 | 27.83% |
| 1920 | 3,238 | 54.70% | 2,370 | 40.03% | 312 | 5.27% |
| 1916 | 2,527 | 40.07% | 3,661 | 58.06% | 118 | 1.87% |
| 1912 | 683 | 21.07% | 1,407 | 43.41% | 1,151 | 35.51% |
| 1908 | 1,519 | 47.19% | 1,485 | 46.13% | 215 | 6.68% |
| 1904 | 1,700 | 55.77% | 1,130 | 37.07% | 218 | 7.15% |
| 1900 | 1,146 | 45.53% | 1,297 | 51.53% | 74 | 2.94% |
| 1896 | 423 | 20.07% | 1,649 | 78.23% | 36 | 1.71% |
| 1892 | 998 | 43.32% | 1,144 | 49.65% | 162 | 7.03% |
Unified (K-12) districts include:[15]
The Belgrade elementary and high school districts are both a part of Belgrade Public Schools.[16] The Bozeman elementary and high school districts are both a part of Bozeman Public Schools.[17] The Manhattan elementary and high school districts are both a part of Manhattan Public Schools.[18] The Three Forks elementary and high school districts are both a part of Three Forks Public Schools.[19] The Willow Creek elementary and high school districts are both a part of Willow Creek Public Schools.[20]
High school districts include:[15]
Elementary school districts include:[15]
Seamless Wikipedia browsing. On steroids.
Every time you click a link to Wikipedia, Wiktionary or Wikiquote in your browser's search results, it will show the modern Wikiwand interface.
Wikiwand extension is a five stars, simple, with minimum permission required to keep your browsing private, safe and transparent.