Puerto Boyacá
Municipality and town in Boyacá Department, Colombia From Wikipedia, the free encyclopedia
Puerto Boyacá is a Colombian river-port town and municipality by the Magdalena River in the Boyacá Department, where is also considered a Special Trade Zone due to its port status. Its main industries are oil exploration and processing. In the 1980s and early 1990s, Puerto Boyacá was affected intensively by the Colombian Armed Conflict.
Puerto Boyacá, Boyacá, Colombia | |
|---|---|
Municipality and town | |
 Flag  Seal | |
 Location of the municipality and town of Puerto Boyacá in the Boyacá Department of Colombia | |
 Puerto Boyacá, Boyacá, Colombia Location in Colombia | |
| Coordinates: 5°58′41″N 74°35′23″W | |
| Country | Colombia |
| Department | Boyacá Department |
| Province | Boyacá Special Handling Zone |
| Founded | December 14, 1957 |
| Government | |
| • Mayor | Jicly Esgardo Mutis Isaza (2020-2023) |
| Area | |
| 1,514 km2 (585 sq mi) | |
| • Urban | 4.08 km2 (1.58 sq mi) |
| Elevation | 145 m (476 ft) |
| Population (2018 census)[1] | |
| 46,736 | |
| • Density | 31/km2 (80/sq mi) |
| • Urban | 32,979 |
| • Urban density | 8,100/km2 (21,000/sq mi) |
| Demonym | Puertoboyacense |
| Time zone | UTC-5 (Colombia Standard Time) |
| Postal code | 152201-19 |
| Area code | 57 + 8 |
| Website | Official website |
Borders
- North - departments of Bolívar, Santander
- West - Magdalena River and Puerto Berrío, Puerto Nare, Puerto Triunfo and Sonsón municipalities of Antioquia Department
- South - Puerto Salgar and Yacopí municipalities of Cundinamarca
- East - municipality of Otanche (Boyacá)
Born in Puerto Boyacá
- Fredy Guarín, Colombian football player
Gallery
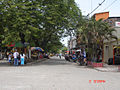 Puerto Boyacá typical street
- El Centro de la ciudad. Downtown city.

Other information
- Market Day: Sunday
- Distance from Tunja: 373 km
- Median temperature: 32 °C
Climate
| Climate data for Puerto Boyacá (Pto Boyaca), elevation 350 m (1,150 ft), (1981–2010) | |||||||||||||
|---|---|---|---|---|---|---|---|---|---|---|---|---|---|
| Month | Jan | Feb | Mar | Apr | May | Jun | Jul | Aug | Sep | Oct | Nov | Dec | Year |
| Record high °C (°F) | 38.6 (101.5) |
39.4 (102.9) |
40.0 (104.0) |
37.4 (99.3) |
37.0 (98.6) |
38.0 (100.4) |
41.2 (106.2) |
41.2 (106.2) |
39.0 (102.2) |
37.4 (99.3) |
37.4 (99.3) |
37.4 (99.3) |
41.2 (106.2) |
| Mean daily maximum °C (°F) | 32.7 (90.9) |
33.2 (91.8) |
32.5 (90.5) |
32.0 (89.6) |
32.2 (90.0) |
32.8 (91.0) |
33.5 (92.3) |
33.8 (92.8) |
32.6 (90.7) |
31.4 (88.5) |
31.3 (88.3) |
31.8 (89.2) |
32.5 (90.5) |
| Daily mean °C (°F) | 28.0 (82.4) |
28.2 (82.8) |
27.8 (82.0) |
27.6 (81.7) |
27.8 (82.0) |
27.9 (82.2) |
28.3 (82.9) |
28.4 (83.1) |
27.6 (81.7) |
27.0 (80.6) |
27.1 (80.8) |
27.5 (81.5) |
27.8 (82.0) |
| Mean daily minimum °C (°F) | 23.7 (74.7) |
23.7 (74.7) |
23.4 (74.1) |
23.1 (73.6) |
23.1 (73.6) |
23.3 (73.9) |
23.1 (73.6) |
23.1 (73.6) |
22.9 (73.2) |
22.7 (72.9) |
23.1 (73.6) |
23.6 (74.5) |
23.2 (73.8) |
| Record low °C (°F) | 20.0 (68.0) |
20.2 (68.4) |
18.0 (64.4) |
17.4 (63.3) |
16.8 (62.2) |
20.0 (68.0) |
20.2 (68.4) |
20.0 (68.0) |
19.0 (66.2) |
19.4 (66.9) |
20.0 (68.0) |
20.6 (69.1) |
16.8 (62.2) |
| Average precipitation mm (inches) | 65.6 (2.58) |
104.4 (4.11) |
181.2 (7.13) |
270.9 (10.67) |
251.3 (9.89) |
167.4 (6.59) |
159.2 (6.27) |
166.9 (6.57) |
258.7 (10.19) |
290.6 (11.44) |
190.4 (7.50) |
115.0 (4.53) |
2,156.6 (84.91) |
| Average precipitation days (≥ 1.0 mm) | 8 | 10 | 14 | 19 | 20 | 17 | 16 | 16 | 18 | 20 | 16 | 11 | 180 |
| Average relative humidity (%) | 76 | 75 | 78 | 80 | 79 | 78 | 75 | 74 | 78 | 81 | 82 | 79 | 78 |
| Source: Instituto de Hidrologia Meteorologia y Estudios Ambientales[2][3] | |||||||||||||
References
External links
Wikiwand - on
Seamless Wikipedia browsing. On steroids.