Poole Borough Council elections
Local government elections in Dorset, England From Wikipedia, the free encyclopedia
Poole was a unitary authority in Dorset, England from 1997 to 2019. From 1974 until 1 April 1997 it was a non-metropolitan district. In 2019 it was abolished and subsumed into Bournemouth, Christchurch and Poole Council.
Political control
The first election to the council was held in 1973, ahead of the local government reorganisation coming into effect the following year. From 1973 until the council's abolition in 2019 political control of the council was held by the following parties:[1]
Lower tier non-metropolitan district
| Party in control | Years | |
|---|---|---|
| Conservative | 1973–1991 | |
| Liberal Democrats | 1991–1997 | |
Unitary authority
| Party in control | Years | |
|---|---|---|
| Liberal Democrats | 1997–1999 | |
| No overall control | 1999–2003 | |
| Conservative | 2003–2011 | |
| No overall control | 2011–2015 | |
| Conservative | 2015–2019 | |
Leadership
The role of mayor was largely ceremonial at Poole Borough Council. Political leadership was instead provided by the leader of the council. The leaders from 2003 until the council's abolition in 2019 were:
| Councillor | Party | From | To | |
|---|---|---|---|---|
| Brian Leverett[2][3] | Conservative | 20 May 2003 | 17 Sep 2010 | |
| Elaine Atkinson[4][5] | Conservative | 26 Oct 2010 | May 2015 | |
| Janet Walton[6][7] | Conservative | 20 May 2015 | 31 Mar 2019 | |
Council elections
Non-metropolitan district elections
- 1973 Poole Borough Council election
- 1976 Poole Borough Council election
- 1979 Poole Borough Council election
- 1983 Poole Borough Council election (New ward boundaries)[8]
- 1987 Poole Borough Council election
- 1991 Poole Borough Council election
Unitary authority elections
- 1996 Poole Borough Council election
- 1999 Poole Borough Council election
- 2003 Poole Borough Council election (New ward boundaries increased the number of seats by three)[9][10]
- 2007 Poole Borough Council election
- 2011 Poole Borough Council election
- 2015 Poole Borough Council election (New ward boundaries)[11]
Council composition
| Year | Conservative | Liberal Democrats | Labour | Poole People | UKIP | Council control after election | |
|---|---|---|---|---|---|---|---|
| 1999 | 17 | 19 | 3 | 0 | 0 | No overall control | |
| 2003 | 26 | 16 | 0 | 0 | 0 | Conservative | |
| 2007 | 25 | 17 | 0 | 0 | 0 | Conservative | |
| 2011 | 21 | 18 | 0 | 3 | 0 | Conservative | |
| 2015 | 32 | 6 | 0 | 3 | 1 | Conservative | |
Borough result maps
 2003 results map
 2007 results map
 2011 results map
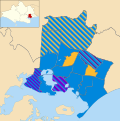 2015 results map


By-election results
Summarize
Perspective
1999-2003
| Party | Candidate | Votes | % | ±% | |
|---|---|---|---|---|---|
| Liberal Democrats | Sandra Moore | 1,825 | |||
| Liberal Democrats | Jeff Allen | 1,747 | |||
| Conservative | Peter Bowler | 1,649 | |||
| Conservative | Roy Oakton | 1,645 | |||
| Labour | George Inglis | 216 | |||
| Labour | Paul Westbrook-Merry | 177 | |||
| Turnout | 7,259 | 33.5 | |||
| Liberal Democrats hold | Swing | ||||
| Liberal Democrats hold | Swing | ||||
Resignation of Cllr Andrew Muspratt and Cllr Marian Mackenzie[12]
2003-2007
| Party | Candidate | Votes | % | ±% | |
|---|---|---|---|---|---|
| Liberal Democrats | Lindsay Wilson | 1,392 | 58.4 | +11.4 | |
| Conservative | Wendy Herring | 527 | 22.1 | −13.7 | |
| Labour | Philip Murray | 327 | 13.7 | −0.7 | |
| Independent | Nicholas Tapping | 77 | 3.2 | +3.2 | |
| Independent | Doreen Renphrey | 61 | 2.6 | +2.6 | |
| Majority | 825 | 36.3 | |||
| Turnout | 2,384 | 30.3 | |||
| Liberal Democrats hold | Swing | ||||
Resignation of Cllr Bob Dugdale[13]
2007-2011
| Party | Candidate | Votes | % | ±% | |
|---|---|---|---|---|---|
| Conservative | Karen Rampton | 923 | 55.2 | +4.7 | |
| Liberal Democrats | Matthew Gillett | 750 | 44.8 | +26.0 | |
| Majority | 173 | 10.4 | |||
| Turnout | 1,673 | 35.0 | |||
| Conservative hold | Swing | ||||
Death of Cllr Mary Hillman[14]
| Party | Candidate | Votes | % | ±% | |
|---|---|---|---|---|---|
| Liberal Democrats | Jo Clements | 809 | 48.3 | −4.1 | |
| Conservative | Tony Reeves | 481 | 28.7 | −7.7 | |
| Labour | Tony Reeves | 205 | 12.2 | +12.2 | |
| UKIP | Diana Butler | 114 | 6.8 | +0.8 | |
| BNP | William Kimmet | 66 | 3.9 | +3.9 | |
| Majority | 328 | 19.6 | |||
| Turnout | 1,675 | ||||
| Liberal Democrats hold | Swing | ||||
Resignation of Cllr Daniel Martin[16]
| Party | Candidate | Votes | % | ±% | |
|---|---|---|---|---|---|
| Liberal Democrats | Jo Clements | 809 | |||
| Conservative | Tony Reeves | 481 | |||
| Labour | Jason Sanderson | 205 | |||
| UKIP | Diana Butler | 114 | |||
| BNP | William Kimmet | 66 | |||
| Majority | 328 | ||||
| Turnout | 17.86 | ||||
| Liberal Democrats hold | Swing | ||||
Resignation of Cllr Michael Plummer[17]
| Party | Candidate | Votes | % | ±% | |
|---|---|---|---|---|---|
| Poole People | Mark Howell | 463 | |||
| Conservative | Tony Reeves | 438 | |||
| Liberal Democrats | Peter England | 213 | |||
| Labour | Jason Sanderson | 201 | |||
| UKIP | Avril King | 55 | |||
| BNP | William Kimmet | 32 | |||
| Majority | 25 | ||||
| Turnout | 17.37 | ||||
| Poole People gain from Conservative | Swing | ||||
Death of Cllr Brian Leverett[18]
2011-2015
| Party | Candidate | Votes | % | ±% | |
|---|---|---|---|---|---|
| Conservative | Jane Thomas | 553 | |||
| Liberal Democrats | Jenny Paton | 254 | |||
| Poole People | Peter Portnoi | 245 | |||
| UKIP | Diana Mary Butler | 132 | |||
| Labour | Hazel Malcom-Walker | 104 | |||
| BNP | William Kimmet | 28 | |||
| Majority | 199 | ||||
| Turnout | 27.58 | ||||
| Conservative hold | Swing | ||||
Resignation of Cllr Stephen Rollo-Smith.[19]
2015-2019
| Party | Candidate | Votes | % | ±% | |
|---|---|---|---|---|---|
| Liberal Democrats | Vikki Slade | 2,184 | |||
| Conservative | Marc Ujvari | 733 | |||
| UKIP | Alan Gerring | 121 | |||
| Green | Mark Chivers | 57 | |||
| Labour | Jason Sanderson | 45 | |||
| Majority | 1,451 | ||||
| Turnout | 37.23 | ||||
| Liberal Democrats gain from Conservative | Swing | ||||
Resignation of Cllr Joanne Tomlin.[20]
References
External links
Wikiwand - on
Seamless Wikipedia browsing. On steroids.