Mandelbrot set
Fractal named after mathematician Benoit Mandelbrot From Wikipedia, the free encyclopedia
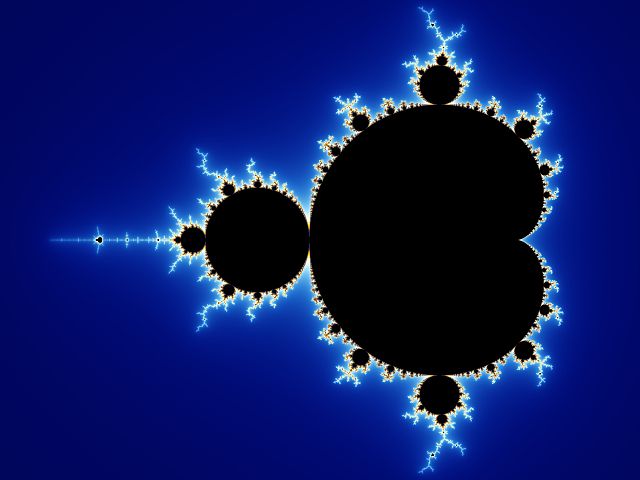
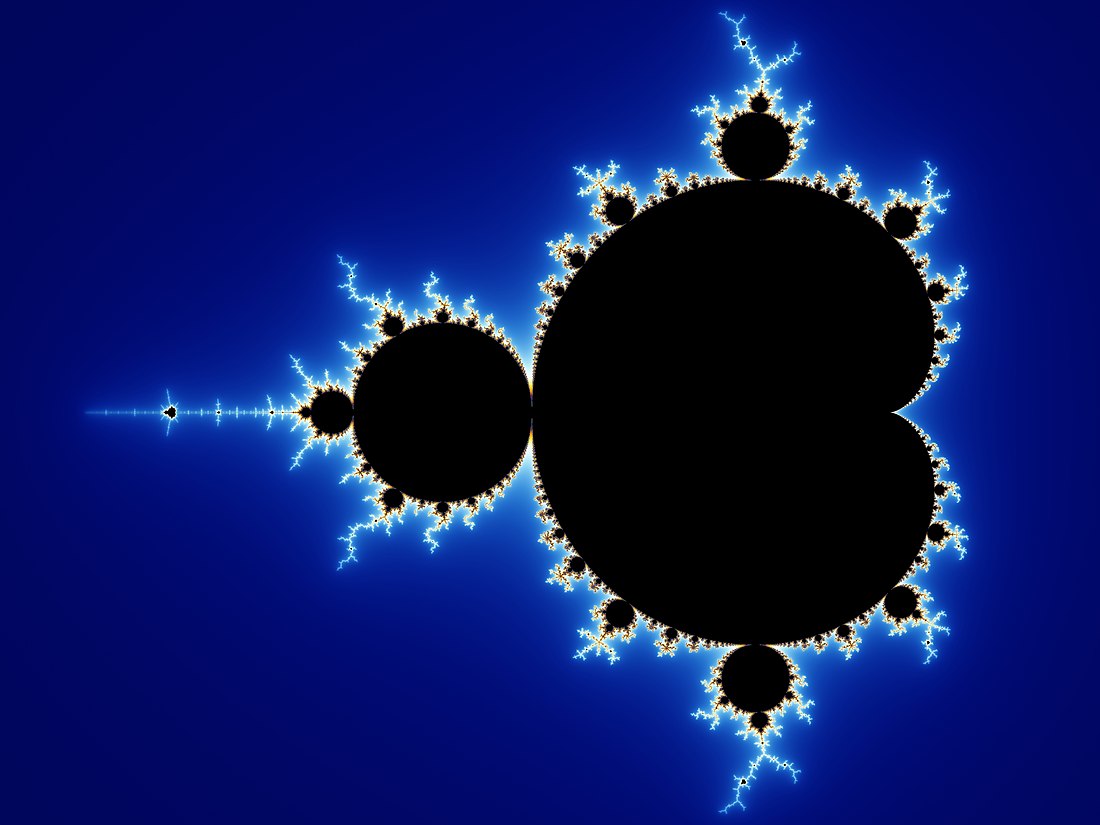
The Mandelbrot set (/ˈmændəlbroʊt, -brɒt/)[1][2] is a two-dimensional set which is very popular,[3] even outside mathematics,[4] due to how, despite having a relatively simple definition,[5] it exhibits complex fractal structures[6] when visualized and magnified.[7] The set is defined in the complex plane as the complex numbers for which the function does not diverge to infinity when iterated starting at , i.e., for which the sequence , , etc., remains bounded in absolute value.[8]
This article needs additional citations for verification. (June 2024) |
This set was first defined and drawn by Robert W. Brooks and Peter Matelski in 1978, as part of a study of Kleinian groups.[9] Afterwards, in 1980, Benoit Mandelbrot obtained high-quality visualizations of the set while working at IBM's Thomas J. Watson Research Center in Yorktown Heights, New York.[10]
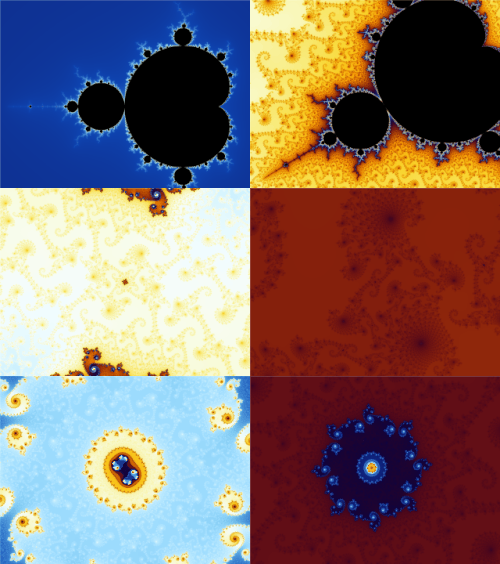
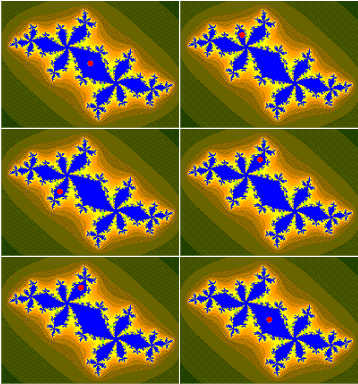
Images of the Mandelbrot set exhibit an infinitely complicated boundary that reveals progressively ever-finer recursive detail at increasing magnifications;[11][12] mathematically, the boundary of the Mandelbrot set is a fractal curve.[13] The "style" of this recursive detail depends on the region of the set boundary being examined.[14] Mandelbrot set images may be created by sampling the complex numbers and testing, for each sample point , whether the sequence goes to infinity.[15][close paraphrasing] Treating the real and imaginary parts of as image coordinates on the complex plane, pixels may then be colored according to how soon the sequence crosses an arbitrarily chosen threshold (the threshold must be at least 2, as −2 is the complex number with the largest magnitude within the set, but otherwise the threshold is arbitrary).[15][close paraphrasing] If is held constant and the initial value of is varied instead, the corresponding Julia set for the point is obtained.[16]
History
Summarize
Perspective

The Mandelbrot set has its origin in complex dynamics, a field first investigated by the French mathematicians Pierre Fatou and Gaston Julia at the beginning of the 20th century. The fractal was first defined and drawn in 1978 by Robert W. Brooks and Peter Matelski as part of a study of Kleinian groups.[9] On 1 March 1980, at IBM's Thomas J. Watson Research Center in Yorktown Heights, New York, Benoit Mandelbrot first visualized the set.[17]
Mandelbrot studied the parameter space of quadratic polynomials in an article that appeared in 1980.[18] The mathematical study of the Mandelbrot set really began with work by the mathematicians Adrien Douady and John H. Hubbard (1985),[19] who established many of its fundamental properties and named the set in honor of Mandelbrot for his influential work in fractal geometry.
The mathematicians Heinz-Otto Peitgen and Peter Richter became well known for promoting the set with photographs, books (1986),[20] and an internationally touring exhibit of the German Goethe-Institut (1985).[21][22]
The cover article of the August 1985 Scientific American introduced the algorithm for computing the Mandelbrot set. The cover was created by Peitgen, Richter and Saupe at the University of Bremen.[23] The Mandelbrot set became prominent in the mid-1980s as a computer-graphics demo, when personal computers became powerful enough to plot and display the set in high resolution.[24]
The work of Douady and Hubbard occurred during an increase in interest in complex dynamics and abstract mathematics,[25] and the topological and geometric study of the Mandelbrot set remains a key topic in the field of complex dynamics.[26]
Formal definition
The Mandelbrot set is the uncountable set of values of c in the complex plane for which the orbit of the critical point under iteration of the quadratic map
remains bounded.[28] Thus, a complex number c is a member of the Mandelbrot set if, when starting with and applying the iteration repeatedly, the absolute value of remains bounded for all .
For example, for c = 1, the sequence is 0, 1, 2, 5, 26, ..., which tends to infinity, so 1 is not an element of the Mandelbrot set. On the other hand, for , the sequence is 0, −1, 0, −1, 0, ..., which is bounded, so −1 does belong to the set.
The Mandelbrot set can also be defined as the connectedness locus of the family of quadratic polynomials , the subset of the space of parameters for which the Julia set of the corresponding polynomial forms a connected set.[29] In the same way, the boundary of the Mandelbrot set can be defined as the bifurcation locus of this quadratic family, the subset of parameters near which the dynamic behavior of the polynomial (when it is iterated repeatedly) changes drastically.
Basic properties
Summarize
Perspective
The Mandelbrot set is a compact set, since it is closed and contained in the closed disk of radius 2 centred on zero. A point belongs to the Mandelbrot set if and only if for all . In other words, the absolute value of must remain at or below 2 for to be in the Mandelbrot set, , and if that absolute value exceeds 2, the sequence will escape to infinity. Since , it follows that , establishing that will always be in the closed disk of radius 2 around the origin.[30]


The intersection of with the real axis is the interval . The parameters along this interval can be put in one-to-one correspondence with those of the real logistic family,
The correspondence is given by
This gives a correspondence between the entire parameter space of the logistic family and that of the Mandelbrot set.[31]
Douady and Hubbard showed that the Mandelbrot set is connected. They constructed an explicit conformal isomorphism between the complement of the Mandelbrot set and the complement of the closed unit disk. Mandelbrot had originally conjectured that the Mandelbrot set is disconnected. This conjecture was based on computer pictures generated by programs that are unable to detect the thin filaments connecting different parts of . Upon further experiments, he revised his conjecture, deciding that should be connected. A topological proof of the connectedness was discovered in 2001 by Jeremy Kahn.[32]

The dynamical formula for the uniformisation of the complement of the Mandelbrot set, arising from Douady and Hubbard's proof of the connectedness of , gives rise to external rays of the Mandelbrot set. These rays can be used to study the Mandelbrot set in combinatorial terms and form the backbone of the Yoccoz parapuzzle.[33]
The boundary of the Mandelbrot set is the bifurcation locus of the family of quadratic polynomials. In other words, the boundary of the Mandelbrot set is the set of all parameters for which the dynamics of the quadratic map exhibits sensitive dependence on i.e. changes abruptly under arbitrarily small changes of It can be constructed as the limit set of a sequence of plane algebraic curves, the Mandelbrot curves, of the general type known as polynomial lemniscates. The Mandelbrot curves are defined by setting , and then interpreting the set of points in the complex plane as a curve in the real Cartesian plane of degree in x and y.[34] Each curve is the mapping of an initial circle of radius 2 under . These algebraic curves appear in images of the Mandelbrot set computed using the "escape time algorithm" mentioned below.
Other properties
Summarize
Perspective
Main cardioid and period bulbs

The main cardioid is the period 1 continent.[35] It is the region of parameters for which the map has an attracting fixed point.[36] It consists of all parameters of the form for some in the open unit disk.[37][close paraphrasing]
To the left of the main cardioid, attached to it at the point , a circular bulb, the period-2 bulb is visible.[37][close paraphrasing] The bulb consists of for which has an attracting cycle of period 2. It is the filled circle of radius 1/4 centered around −1.[37][close paraphrasing]
More generally, for every positive integer , there are circular bulbs tangent to the main cardioid called period-q bulbs (where denotes the Euler phi function), which consist of parameters for which has an attracting cycle of period .[citation needed] More specifically, for each primitive th root of unity (where ), there is one period-q bulb called the bulb, which is tangent to the main cardioid at the parameter and which contains parameters with -cycles having combinatorial rotation number .[38] More precisely, the periodic Fatou components containing the attracting cycle all touch at a common point (commonly called the -fixed point). If we label these components in counterclockwise orientation, then maps the component to the component .[37][close paraphrasing]

The change of behavior occurring at is known as a bifurcation: the attracting fixed point "collides" with a repelling period-q cycle. As we pass through the bifurcation parameter into the -bulb, the attracting fixed point turns into a repelling fixed point (the -fixed point), and the period-q cycle becomes attracting.[37][close paraphrasing]
Hyperbolic components
Bulbs that are interior components of the Mandelbrot set in which the maps have an attracting periodic cycle are called hyperbolic components.[39]
It is conjectured that these are the only interior regions of and that they are dense in . This problem, known as density of hyperbolicity, is one of the most important open problems in complex dynamics.[40] Hypothetical non-hyperbolic components of the Mandelbrot set are often referred to as "queer" or ghost components.[41][42] For real quadratic polynomials, this question was proved in the 1990s independently by Lyubich and by Graczyk and Świątek. (Note that hyperbolic components intersecting the real axis correspond exactly to periodic windows in the Feigenbaum diagram. So this result states that such windows exist near every parameter in the diagram.)
Not every hyperbolic component can be reached by a sequence of direct bifurcations from the main cardioid of the Mandelbrot set. Such a component can be reached by a sequence of direct bifurcations from the main cardioid of a little Mandelbrot copy (see below).

Each of the hyperbolic components has a center, which is a point c such that the inner Fatou domain for has a super-attracting cycle—that is, that the attraction is infinite. This means that the cycle contains the critical point 0, so that 0 is iterated back to itself after some iterations. Therefore, for some n. If we call this polynomial (letting it depend on c instead of z), we have that and that the degree of is . Therefore, constructing the centers of the hyperbolic components is possible by successively solving the equations .[citation needed] The number of new centers produced in each step is given by Sloane's OEIS: A000740.
Local connectivity
It is conjectured that the Mandelbrot set is locally connected. This conjecture is known as MLC (for Mandelbrot locally connected). By the work of Adrien Douady and John H. Hubbard, this conjecture would result in a simple abstract "pinched disk" model of the Mandelbrot set. In particular, it would imply the important hyperbolicity conjecture mentioned above.[citation needed]
The work of Jean-Christophe Yoccoz established local connectivity of the Mandelbrot set at all finitely renormalizable parameters; that is, roughly speaking those contained only in finitely many small Mandelbrot copies.[43] Since then, local connectivity has been proved at many other points of , but the full conjecture is still open.
Self-similarity
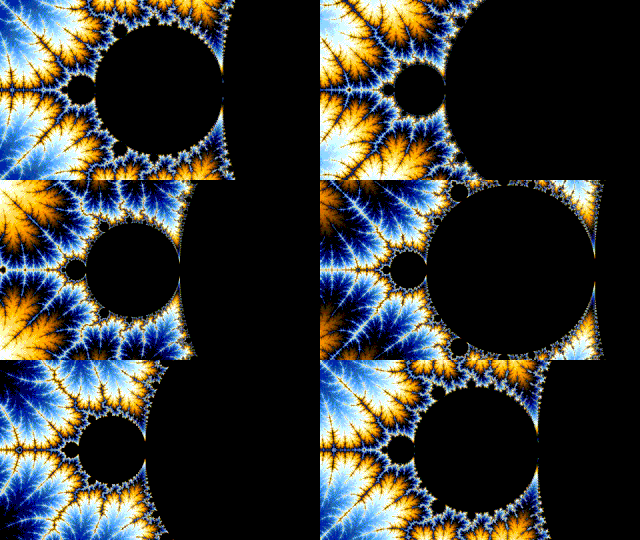
The Mandelbrot set is self-similar under magnification in the neighborhoods of the Misiurewicz points. It is also conjectured to be self-similar around generalized Feigenbaum points (e.g., −1.401155 or −0.1528 + 1.0397i), in the sense of converging to a limit set.[44][45] The Mandelbrot set in general is quasi-self-similar, as small slightly different versions of itself can be found at arbitrarily small scales. These copies of the Mandelbrot set are all slightly different, mostly because of the thin threads connecting them to the main body of the set.[46]
Further results
The Hausdorff dimension of the boundary of the Mandelbrot set equals 2 as determined by a result of Mitsuhiro Shishikura.[47] The fact that this is greater by a whole integer than its topological dimension, which is 1, reflects the extreme fractal nature of the Mandelbrot set boundary. Roughly speaking, Shishikura's result states that the Mandelbrot set boundary is so "wiggly" that it locally fills space as efficiently as a two-dimensional planar region. Curves with Hausdorff dimension 2, despite being (topologically) 1-dimensional, are oftentimes capable of having nonzero area (more formally, a nonzero planar Lebesgue measure). Whether this is the case for the Mandelbrot set boundary is an unsolved problem.[citation needed]
It has been shown that the generalized Mandelbrot set in higher-dimensional hypercomplex number spaces (i.e. when the power of the iterated variable tends to infinity) is convergent to the unit (−1)-sphere.[48]
In the Blum–Shub–Smale model of real computation, the Mandelbrot set is not computable, but its complement is computably enumerable. Many simple objects (e.g., the graph of exponentiation) are also not computable in the BSS model. At present, it is unknown whether the Mandelbrot set is computable in models of real computation based on computable analysis, which correspond more closely to the intuitive notion of "plotting the set by a computer". Hertling has shown that the Mandelbrot set is computable in this model if the hyperbolicity conjecture is true.[citation needed]
Relationship with Julia sets

As a consequence of the definition of the Mandelbrot set, there is a close correspondence between the geometry of the Mandelbrot set at a given point and the structure of the corresponding Julia set. For instance, a value of c belongs to the Mandelbrot set if and only if the corresponding Julia set is connected. Thus, the Mandelbrot set may be seen as a map of the connected Julia sets.[49][better source needed]
This principle is exploited in virtually all deep results on the Mandelbrot set. For example, Shishikura proved that, for a dense set of parameters in the boundary of the Mandelbrot set, the Julia set has Hausdorff dimension two, and then transfers this information to the parameter plane.[47] Similarly, Yoccoz first proved the local connectivity of Julia sets, before establishing it for the Mandelbrot set at the corresponding parameters.[43]
Geometry
Summarize
Perspective
For every rational number , where p and q are coprime, a hyperbolic component of period q bifurcates from the main cardioid at a point on the edge of the cardioid corresponding to an internal angle of .[50] The part of the Mandelbrot set connected to the main cardioid at this bifurcation point is called the p/q-limb. Computer experiments suggest that the diameter of the limb tends to zero like . The best current estimate known is the Yoccoz-inequality, which states that the size tends to zero like .[citation needed]
A period-q limb will have "antennae" at the top of its limb. The period of a given bulb is determined by counting these antennas. The numerator of the rotation number, p, is found by numbering each antenna counterclockwise from the limb from 1 to and finding which antenna is the shortest.[50]
Pi in the Mandelbrot set
In an attempt to demonstrate that the thickness of the p/q-limb is zero, David Boll carried out a computer experiment in 1991, where he computed the number of iterations required for the series to diverge for ( being the location thereof). As the series does not diverge for the exact value of , the number of iterations required increases with a small . It turns out that multiplying the value of with the number of iterations required yields an approximation of that becomes better for smaller . For example, for = 0.0000001, the number of iterations is 31415928 and the product is 3.1415928.[51] In 2001, Aaron Klebanoff proved Boll's discovery.[52]
Fibonacci sequence in the Mandelbrot set
The Mandelbrot Set features a fundamental cardioid shape adorned with numerous bulbs directly attached to it.[53] Understanding the arrangement of these bulbs requires a detailed examination of the Mandelbrot Set's boundary. As one zooms into specific portions with a geometric perspective, precise deducible information about the location within the boundary and the corresponding dynamical behavior for parameters drawn from associated bulbs emerges.[54]
The iteration of the quadratic polynomial , where is a parameter drawn from one of the bulbs attached to the main cardioid within the Mandelbrot Set, gives rise to maps featuring attracting cycles of a specified period and a rotation number . In this context, the attracting cycle of exhibits rotational motion around a central fixed point, completing an average of revolutions at each iteration.[54][55]
The bulbs within the Mandelbrot Set are distinguishable by both their attracting cycles and the geometric features of their structure. Each bulb is characterized by an antenna attached to it, emanating from a junction point and displaying a certain number of spokes indicative of its period. For instance, the bulb is identified by its attracting cycle with a rotation number of . Its distinctive antenna-like structure comprises a junction point from which five spokes emanate. Among these spokes, called the principal spoke is directly attached to the bulb, and the 'smallest' non-principal spoke is positioned approximately of a turn counterclockwise from the principal spoke, providing a distinctive identification as a -bulb.[56] This raises the question: how does one discern which among these spokes is the 'smallest'?[53][56] In the theory of external rays developed by Douady and Hubbard,[57] there are precisely two external rays landing at the root point of a satellite hyperbolic component of the Mandelbrot Set. Each of these rays possesses an external angle that undergoes doubling under the angle doubling map . According to this theorem, when two rays land at the same point, no other rays between them can intersect. Thus, the 'size' of this region is measured by determining the length of the arc between the two angles.[54]
If the root point of the main cardioid is the cusp at , then the main cardioid is the -bulb. The root point of any other bulb is just the point where this bulb is attached to the main cardioid. This prompts the inquiry: which is the largest bulb between the root points of the and -bulbs? It is clearly the -bulb. And note that is obtained from the previous two fractions by Farey addition, i.e., adding the numerators and adding the denominators
Similarly, the largest bulb between the and -bulbs is the -bulb, again given by Farey addition.
The largest bulb between the and -bulb is the -bulb, while the largest bulb between the and -bulbs is the -bulb, and so on.[54][58] The arrangement of bulbs within the Mandelbrot set follows a remarkable pattern governed by the Farey tree, a structure encompassing all rationals between and . This ordering positions the bulbs along the boundary of the main cardioid precisely according to the rational numbers in the unit interval.[56]

Starting with the bulb at the top and progressing towards the circle, the sequence unfolds systematically: the largest bulb between and is , between and is , and so forth.[59] Intriguingly, the denominators of the periods of circular bulbs at sequential scales in the Mandelbrot Set conform to the Fibonacci number sequence, the sequence that is made by adding the previous two terms – 1, 2, 3, 5, 8, 13, 21...[60][61]
The Fibonacci sequence manifests in the number of spiral arms at a unique spot on the Mandelbrot set, mirrored both at the top and bottom. This distinctive location demands the highest number of iterations of for a detailed fractal visual, with intricate details repeating as one zooms in.[62]
Image gallery of a zoom sequence
The boundary of the Mandelbrot set shows more intricate detail the closer one looks or magnifies the image. The following is an example of an image sequence zooming to a selected c value.
The magnification of the last image relative to the first one is about 1010 to 1. Relating to an ordinary computer monitor, it represents a section of a Mandelbrot set with a diameter of 4 million kilometers.
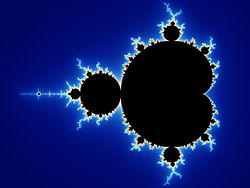
- Start. Mandelbrot set with continuously colored environment.
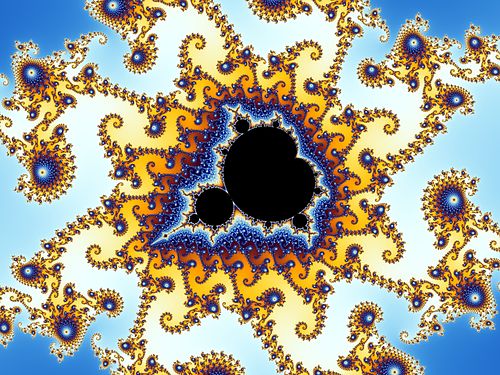
- Gap between the "head" and the "body", also called the "seahorse valley"[63]
- Double-spirals on the left, "seahorses" on the right
- "Seahorse" upside down
The seahorse "body" is composed by 25 "spokes" consisting of two groups of 12 "spokes"[64] each and one "spoke" connecting to the main cardioid. These two groups can be attributed by some metamorphosis to the two "fingers" of the "upper hand" of the Mandelbrot set; therefore, the number of "spokes" increases from one "seahorse" to the next by 2; the "hub" is a Misiurewicz point. Between the "upper part of the body" and the "tail", there is a distorted copy of the Mandelbrot set, called a "satellite".
- The central endpoint of the "seahorse tail" is also a Misiurewicz point.
- Part of the "tail" – there is only one path consisting of the thin structures that lead through the whole "tail". This zigzag path passes the "hubs" of the large objects with 25 "spokes" at the inner and outer border of the "tail"; thus the Mandelbrot set is a simply connected set, which means there are no islands and no loop roads around a hole.
- Satellite. The two "seahorse tails" (also called dendritic structures)[65] are the beginning of a series of concentric crowns with the satellite in the center.
- Each of these crowns consists of similar "seahorse tails"; their number increases with powers of 2, a typical phenomenon in the environment of satellites. The unique path to the spiral center passes the satellite from the groove of the cardioid to the top of the "antenna" on the "head".
- "Antenna" of the satellite. There are several satellites of second order.
- The "seahorse valley"[63] of the satellite. All the structures from the start reappear.
- Double-spirals and "seahorses" – unlike the second image from the start, they have appendices consisting of structures like "seahorse tails"; this demonstrates the typical linking of n + 1 different structures in the environment of satellites of the order n, here for the simplest case n = 1.
- Double-spirals with satellites of second order – analogously to the "seahorses", the double-spirals may be interpreted as a metamorphosis of the "antenna".
- In the outer part of the appendices, islands of structures may be recognized; they have a shape like Julia sets Jc; the largest of them may be found in the center of the "double-hook" on the right side.
- Part of the "double-hook".
- Islands.
- A detail of one island.
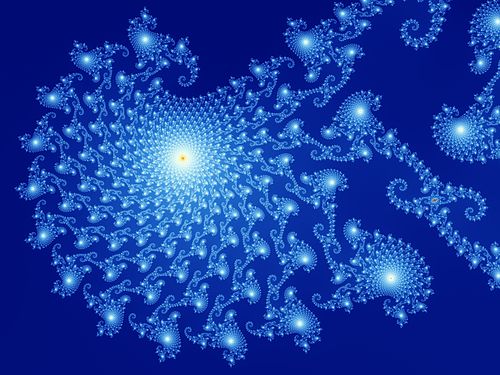
- Detail of the spiral.
The islands in the third-to-last step seem to consist of infinitely many parts, as is the case for the corresponding Julia set . They are connected by tiny structures, so that the whole represents a simply connected set. The tiny structures meet each other at a satellite in the center that is too small to be recognized at this magnification. The value of for the corresponding is not the image center but, relative to the main body of the Mandelbrot set, has the same position as the center of this image relative to the satellite shown in the 6th step.
Inner structure
While the Mandelbrot set is typically rendered showing outside boundary detail, structure within the bounded set can also be revealed.[66][67][68] For example, while calculating whether or not a given c value is bound or unbound, while it remains bound, the maximum value that this number reaches can be compared to the c value at that location. If the sum of squares method is used, the calculated number would be max:(real^2 + imaginary^2) − c:(real^2 + imaginary^2).[citation needed] The magnitude of this calculation can be rendered as a value on a gradient.
This produces results like the following, gradients with distinct edges and contours as the boundaries are approached. The animations serve to highlight the gradient boundaries.
- Animated gradient structure inside the Mandelbrot set
- Animated gradient structure inside the Mandelbrot set, detail
- Rendering of progressive iterations from 285 to approximately 200,000 with corresponding bounded gradients animated
- Thumbnail for gradient in progressive iterations
Generalizations
Summarize
Perspective

Multibrot sets
Multibrot sets are bounded sets found in the complex plane for members of the general monic univariate polynomial family of recursions
- .[69]
For an integer d, these sets are connectedness loci for the Julia sets built from the same formula. The full cubic connectedness locus has also been studied; here one considers the two-parameter recursion , whose two critical points are the complex square roots of the parameter k. A parameter is in the cubic connectedness locus if both critical points are stable.[70] For general families of holomorphic functions, the boundary of the Mandelbrot set generalizes to the bifurcation locus.[citation needed]
The Multibrot set is obtained by varying the value of the exponent d. The article has a video that shows the development from d = 0 to 7, at which point there are 6 i.e. lobes around the perimeter. In general, when d is a positive integer, the central region in each of these sets is always an epicycloid of cusps. A similar development with negative integral exponents results in clefts on the inside of a ring, where the main central region of the set is a hypocycloid of cusps.[citation needed]
Higher dimensions
There is no perfect extension of the Mandelbrot set into 3D, because there is no 3D analogue of the complex numbers for it to iterate on. There is an extension of the complex numbers into 4 dimensions, the quaternions, that creates a perfect extension of the Mandelbrot set and the Julia sets into 4 dimensions.[71] These can then be either cross-sectioned or projected into a 3D structure. The quaternion (4-dimensional) Mandelbrot set is simply a solid of revolution of the 2-dimensional Mandelbrot set (in the j-k plane), and is therefore uninteresting to look at.[71] Taking a 3-dimensional cross section at results in a solid of revolution of the 2-dimensional Mandelbrot set around the real axis.[citation needed]
Other non-analytic mappings

The tricorn fractal, also called the Mandelbar set, is the connectedness locus of the anti-holomorphic family .[72][73] It was encountered by Milnor in his study of parameter slices of real cubic polynomials.[citation needed] It is not locally connected.[72] This property is inherited by the connectedness locus of real cubic polynomials.[citation needed]
Another non-analytic generalization is the Burning Ship fractal, which is obtained by iterating the following:
Computer drawings
Summarize
Perspective
There exist a multitude of various algorithms for plotting the Mandelbrot set via a computing device. Here, the naïve[74] "escape time algorithm" will be shown, since it is the most popular[75] and one of the simplest algorithms.[76] In the escape time algorithm, a repeating calculation is performed for each x, y point in the plot area and based on the behavior of that calculation, a color is chosen for that pixel.[77][78]
The x and y locations of each point are used as starting values in a repeating, or iterating calculation (described in detail below). The result of each iteration is used as the starting values for the next. The values are checked during each iteration to see whether they have reached a critical "escape" condition, or "bailout". If that condition is reached, the calculation is stopped, the pixel is drawn, and the next x, y point is examined.
The color of each point represents how quickly the values reached the escape point. Often black is used to show values that fail to escape before the iteration limit, and gradually brighter colors are used for points that escape. This gives a visual representation of how many cycles were required before reaching the escape condition.
To render such an image, the region of the complex plane we are considering is subdivided into a certain number of pixels. To color any such pixel, let be the midpoint of that pixel. Iterate the critical point 0 under , checking at each step whether the orbit point has a radius larger than 2. When this is the case, does not belong to the Mandelbrot set, and color the pixel according to the number of iterations used to find out. Otherwise, keep iterating up to a fixed number of steps, after which we decide that our parameter is "probably" in the Mandelbrot set, or at least very close to it, and color the pixel black.
In pseudocode, this algorithm would look as follows. The algorithm does not use complex numbers and manually simulates complex-number operations using two real numbers, for those who do not have a complex data type. The program may be simplified if the programming language includes complex-data-type operations.
for each pixel (Px, Py) on the screen do
    x0 := scaled x coordinate of pixel (scaled to lie in the Mandelbrot X scale (-2.00, 0.47))
    y0 := scaled y coordinate of pixel (scaled to lie in the Mandelbrot Y scale (-1.12, 1.12))
    x := 0.0
    y := 0.0
    iteration := 0
    max_iteration := 1000
    while (x^2 + y^2 ≤ 2^2 AND iteration < max_iteration) do
        xtemp := x^2 - y^2 + x0
        y := 2*x*y + y0
        x := xtemp
        iteration := iteration + 1


    color := palette[iteration]
    plot(Px, Py, color)
Here, relating the pseudocode to , and :
and so, as can be seen in the pseudocode in the computation of x and y:
- and .
To get colorful images of the set, the assignment of a color to each value of the number of executed iterations can be made using one of a variety of functions (linear, exponential, etc.).
Python code
Here is the code implementing the above algorithm in Python:[79][close paraphrasing]
import numpy as np
import matplotlib.pyplot as plt

# setting parameters (these values can be changed)
xDomain, yDomain = np.linspace(-2, 2, 500), np.linspace(-2, 2, 500)
bound = 2
max_iterations = 50  # any positive integer value
colormap = "nipy_spectral"  # set to any matplotlib valid colormap

func = lambda z, p, c: z**p + c

# computing 2-d array to represent the mandelbrot-set
iterationArray = []
for y in yDomain:
    row = []
    for x in xDomain:
        z = 0
        p = 2
        c = complex(x, y)
        for iterationNumber in range(max_iterations):
            if abs(z) >= bound:
                row.append(iterationNumber)
                break
            else:
                try:
                    z = func(z, p, c)
                except(ValueError, ZeroDivisionError):
                    z = c
        else:
            row.append(0)

    iterationArray.append(row)

# plotting the data
ax = plt.axes()
ax.set_aspect("equal")
graph = ax.pcolormesh(xDomain, yDomain, iterationArray, cmap=colormap)
plt.colorbar(graph)
plt.xlabel("Real-Axis")
plt.ylabel("Imaginary-Axis")
plt.show()

The value of power variable can be modified to generate an image of equivalent multibrot set (). For example, setting p = 2 produces the associated image.
References in popular culture
Summarize
Perspective
The Mandelbrot set is widely considered the most popular fractal,[80][81] and has been referenced several times in popular culture.
- The Jonathan Coulton song "Mandelbrot Set" is a tribute to both the fractal itself and to the man it is named after, Benoit Mandelbrot.[82]
- Blue Man Group's 1999 debut album Audio references the Mandelbrot set in the titles of the songs "Opening Mandelbrot", "Mandelgroove", and "Klein Mandelbrot".[83] Their second album, The Complex (2003), closes with a hidden track titled "Mandelbrot IV".
- The second book of the Mode series by Piers Anthony, Fractal Mode, describes a world that is a perfect 3D model of the set.[84]
- The Arthur C. Clarke novel The Ghost from the Grand Banks features an artificial lake made to replicate the shape of the Mandelbrot set.[85]
- Benoit Mandelbrot and the eponymous set were the subjects of the Google Doodle on 20 November 2020 (the late Benoit Mandelbrot's 96th birthday).[86]
- The American rock band Heart has an image of a Mandelbrot set on the cover of their 2004 album, Jupiters Darling.
- The British black metal band Anaal Nathrakh uses an image resembling the Mandelbrot set on their Eschaton album cover art.
- The television series Dirk Gently's Holistic Detective Agency (2016) prominently features the Mandelbrot set in connection with the visions of the character Amanda. In the second season, her jacket has a large image of the fractal on the back.[87]
- In Ian Stewart's 2001 book Flatterland, there is a character called the Mandelblot, who helps explain fractals to the characters and reader.[88]
- The unfinished Alan Moore 1990 comic book series Big Numbers used Mandelbrot's work on fractal geometry and chaos theory to underpin the structure of that work. Moore at one point was going to the name the comic book series The Mandelbrot Set.[89]
- In the manga The Summer Hikaru Died, Yoshiki hallucinates the Mandelbrot set when he reaches into the body of the false Hikaru.
See also
References
Further reading
External links
Wikiwand - on
Seamless Wikipedia browsing. On steroids.


![{\displaystyle \left[-2,{\frac {1}{4}}\right]}](http://wikimedia.org/api/rest_v1/media/math/render/svg/c22bf73a63f70e2801160f8680a43caad5ca10dd)
![{\displaystyle x_{n+1}=rx_{n}(1-x_{n}),\quad r\in [1,4].}](http://wikimedia.org/api/rest_v1/media/math/render/svg/167c3aa4bc1c5840ca0df792debf16643264a7f7)


