Basingstoke and Deane Borough Council elections
Local government elections in Hampshire, England From Wikipedia, the free encyclopedia
One third of Basingstoke and Deane Borough Council in Hampshire, England is elected each year, followed by one year without election. Since the last boundary changes in 2021, 54 councillors have been elected from 18 wards.
Council elections
- 1973 Basingstoke District Council election
- 1976 Basingstoke District Council election (New ward boundaries)[1]
- 1979 Basingstoke and Deane Borough Council election
- 1980 Basingstoke and Deane Borough Council election
- 1982 Basingstoke and Deane Borough Council election
- 1983 Basingstoke and Deane Borough Council election
- 1984 Basingstoke and Deane Borough Council election
- 1986 Basingstoke and Deane Borough Council election (Borough boundary changes took place but the number of seats remained the same)[2]
- 1987 Basingstoke and Deane Borough Council election
- 1988 Basingstoke and Deane Borough Council election
- 1990 Basingstoke and Deane Borough Council election
- 1991 Basingstoke and Deane Borough Council election (Borough boundary changes took place but the number of seats remained the same)[3]
- 1992 Basingstoke and Deane Borough Council election (New ward boundaries)[4]
- 1994 Basingstoke and Deane Borough Council election
- 1995 Basingstoke and Deane Borough Council election
- 1996 Basingstoke and Deane Borough Council election
- 1998 Basingstoke and Deane Borough Council election
- 1999 Basingstoke and Deane Borough Council election
- 2000 Basingstoke and Deane Borough Council election
- 2002 Basingstoke and Deane Borough Council election (New ward boundaries increased the number of seats by 3)[5][6][7]
- 2003 Basingstoke and Deane Borough Council election
- 2004 Basingstoke and Deane Borough Council election
- 2006 Basingstoke and Deane Borough Council election
- 2007 Basingstoke and Deane Borough Council election
- 2008 Basingstoke and Deane Borough Council election (New ward boundaries)[8][9]
- 2010 Basingstoke and Deane Borough Council election
- 2011 Basingstoke and Deane Borough Council election
- 2012 Basingstoke and Deane Borough Council election
- 2014 Basingstoke and Deane Borough Council election
- 2015 Basingstoke and Deane Borough Council election
- 2016 Basingstoke and Deane Borough Council election
- 2018 Basingstoke and Deane Borough Council election
- 2019 Basingstoke and Deane Borough Council election
- 2021 Basingstoke and Deane Borough Council election (New ward boundaries)[10]
- 2022 Basingstoke and Deane Borough Council election
- 2023 Basingstoke and Deane Borough Council election
- 2024 Basingstoke and Deane Borough Council election
Borough result maps
 2006 results map
 2007 results map
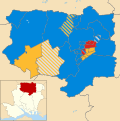 2008 results map
 2010 results map
 2011 results map
 2012 results map
 2014 results map
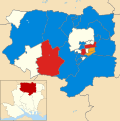 2015 results map
 2016 results map
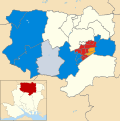 2018 results map
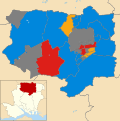 2019 results map
 2021 results map
 2022 results map
 2023 results map
 2024 results map


By-election results
1994-1998
| Party | Candidate | Votes | % | ±% | |
|---|---|---|---|---|---|
| Conservative | 683 | 36.0 | |||
| Liberal Democrats | 646 | 34.0 | |||
| Labour | 409 | 21.9 | |||
| Independent | 152 | 8.0 | |||
| Independent | 7 | 0.4 | |||
| Majority | 37 | 2.0 | |||
| Turnout | 1,897 | 43.4 | |||
| Conservative hold | Swing | ||||
| Party | Candidate | Votes | % | ±% | |
|---|---|---|---|---|---|
| Labour | 892 | 77.4 | |||
| Conservative | 195 | 16.9 | |||
| Liberal Democrats | 65 | 5.6 | |||
| Majority | 697 | 60.5 | |||
| Turnout | 1,152 | 21.0 | |||
| Labour hold | Swing | ||||
| Party | Candidate | Votes | % | ±% | |
|---|---|---|---|---|---|
| Labour | 706 | 65.9 | |||
| Liberal Democrats | 172 | 16.1 | |||
| Conservative | 168 | 15.7 | |||
| Independent | 25 | 2.3 | |||
| Majority | 534 | 49.8 | |||
| Turnout | 1,071 | 19.6 | |||
| Labour hold | Swing | ||||
| Party | Candidate | Votes | % | ±% | |
|---|---|---|---|---|---|
| Labour | 653 | 66.6 | +0.7 | ||
| Conservative | 253 | 25.8 | +10.1 | ||
| Liberal Democrats | 75 | 7.6 | −8.5 | ||
| Majority | 400 | 40.8 | |||
| Turnout | 981 | 17.9 | −1.7 | ||
| Labour hold | Swing | ||||
1998-2002
| Party | Candidate | Votes | % | ±% | |
|---|---|---|---|---|---|
| Labour | 1,503 | 45.8 | +5.0 | ||
| Conservative | 1,243 | 37.9 | +8.4 | ||
| Liberal Democrats | 532 | 16.0 | +2.0 | ||
| Majority | 260 | 7.9 | |||
| Turnout | 3,278 | ||||
| Labour hold | Swing | ||||
2006-2010
| Party | Candidate | Votes | % | ±% | |
|---|---|---|---|---|---|
| Conservative | Robert Taylor | 332 | 47.1 | +15.2 | |
| Labour | Gill Gleeson | 210 | 29.8 | −19.0 | |
| Liberal Democrats | Stephen Day | 123 | 17.4 | +17.4 | |
| Green | Matthew Pinto | 40 | 5.7 | +5.7 | |
| Majority | 122 | 17.3 | |||
| Turnout | 705 | 22.1 | |||
| Conservative gain from Labour | Swing | ||||
| Party | Candidate | Votes | % | ±% | |
|---|---|---|---|---|---|
| Conservative | Karen Cherrett | 156 | 52.7 | −10.9 | |
| Liberal Democrats | Andrew Hood | 122 | 41.2 | +4.8 | |
| Labour | Warwick Dady | 18 | 6.1 | +6.1 | |
| Majority | 34 | 11.5 | |||
| Turnout | 296 | 33.7 | |||
| Conservative hold | Swing | ||||
| Party | Candidate | Votes | % | ±% | |
|---|---|---|---|---|---|
| Liberal Democrats | Eric Dunlop | 858 | 52.8 | −5.6 | |
| Conservative | Bill Judge | 709 | 43.6 | +2.0 | |
| Labour | James Gibb | 58 | 3.6 | +3.6 | |
| Majority | 149 | 9.2 | |||
| Turnout | 1,125 | 42.5 | |||
| Liberal Democrats hold | Swing | ||||
| Party | Candidate | Votes | % | ±% | |
|---|---|---|---|---|---|
| Liberal Democrats | Michael Bound | 428 | 53.8 | +20.3 | |
| Conservative | Zoe Wheddon | 368 | 46.2 | −20.3 | |
| Majority | 60 | 7.6 | |||
| Turnout | 796 | 40.6 | |||
| Liberal Democrats gain from Conservative | Swing | ||||
| Party | Candidate | Votes | % | ±% | |
|---|---|---|---|---|---|
| Conservative | Paul Miller | 898 | 63.0 | +19.1 | |
| Liberal Democrats | Liam Elvish | 249 | 17.5 | +7.7 | |
| Independent | Josephine Walke | 163 | 11.4 | −29.5 | |
| Labour | Simon Broad | 98 | 6.9 | +1.4 | |
| Independent | Tracy Cross | 18 | 1.3 | +1.3 | |
| Majority | 649 | 45.5 | |||
| Turnout | 1,426 | 21.1 | |||
| Conservative hold | Swing | ||||
2014-2018
| Party | Candidate | Votes | % | ±% | |
|---|---|---|---|---|---|
| Conservative | Paul Gaskell | 1,051 | 67.5 | +3.7 | |
| Liberal Democrats | Richard Lilleker | 323 | 20.7 | +8.3 | |
| Labour | Andrew Toal | 184 | 11.8 | −0.1 | |
| Majority | 728 | 46.7 | |||
| Turnout | 1,558 | ||||
| Conservative hold | Swing | -2.3 | |||
| Party | Candidate | Votes | % | ±% | |
|---|---|---|---|---|---|
| Conservative | Kerri Carruthers | 456 | 49.2 | −12.1 | |
| Liberal Democrats | Josephine Slimin | 342 | 36.9 | +13.8 | |
| Labour | Claire Ballard | 88 | 9.5 | −6.1 | |
| UKIP | Philip Heath | 41 | 4.4 | +4.4 | |
| Majority | 114 | 12.3 | |||
| Turnout | 927 | ||||
| Conservative hold | Swing | -13.0 | |||
| Party | Candidate | Votes | % | ±% | |
|---|---|---|---|---|---|
| Labour | Angie Freeman | 824 | 61.6 | +31.2 | |
| Conservative | Chris Hendon | 472 | 35.3 | −10.5 | |
| Liberal Democrats | Zoe-Marie Rogers | 42 | 3.1 | −2.7 | |
| Majority | 352 | 26.3 | |||
| Turnout | 1338 | ||||
| Labour gain from Conservative | Swing | ||||
| Party | Candidate | Votes | % | ±% | |
|---|---|---|---|---|---|
| Conservative | Tomy Capon | 686 | 58.9 | −5.6 | |
| Labour | Grant Donohoe | 366 | 31.4 | +12.3 | |
| Liberal Democrats | Stavroulla O'Doherty | 113 | 9.7 | +9.7 | |
| Majority | 320 | 27.5 | |||
| Turnout | 1,165 | ||||
| Conservative hold | Swing | ||||
2018-2022
| Party | Candidate | Votes | % | ±% | |
|---|---|---|---|---|---|
| Conservative | Anne Court | 884 | 60.4 | −6.4 | |
| Labour | Alex Lee | 475 | 32.4 | +11.2 | |
| Liberal Democrats | Stavroulla O'Doherty | 105 | 7.2 | −4.8 | |
| Majority | 409 | 27.9 | |||
| Turnout | 1,464 | ||||
| Conservative hold | Swing | ||||
| Party | Candidate | Votes | % | ±% | |
|---|---|---|---|---|---|
| Labour | Carolyn Wooldridge | 925 | 68.2 | +2.6 | |
| Conservative | Michael Archer | 288 | 21.2 | −2.5 | |
| Independent | Phil Heath | 80 | 5.9 | +5.9 | |
| Liberal Democrats | Zoe Rogers | 64 | 4.7 | −0.2 | |
| Majority | 637 | 46.9 | |||
| Turnout | 1,357 | ||||
| Labour hold | Swing | ||||
| Party | Candidate | Votes | % | ±% | |
|---|---|---|---|---|---|
| Independent | Chris Tomblin | 800 | 57.2 | +57.2 | |
| Conservative | Angus Groom | 449 | 32.1 | −24.1 | |
| Independent | Joyce Bowyer | 150 | 10.7 | +10.7 | |
| Majority | 351 | 25.1 | |||
| Turnout | 1,399 | ||||
| Independent gain from Conservative | Swing | ||||
References
External links
Wikiwand - on
Seamless Wikipedia browsing. On steroids.