Gilze en Rijen
Municipality in North Brabant, Netherlands From Wikipedia, the free encyclopedia
Gilze en Rijen (Dutch pronunciation: [ˌɣɪlzə ʔɛn ˈrɛiə(n)] ) is a municipality in the southern Netherlands. The municipality contains four villages: Rijen, Gilze, Hulten and Molenschot. It is home to the Gilze-Rijen Air Base.
Gilze en Rijen | |
|---|---|
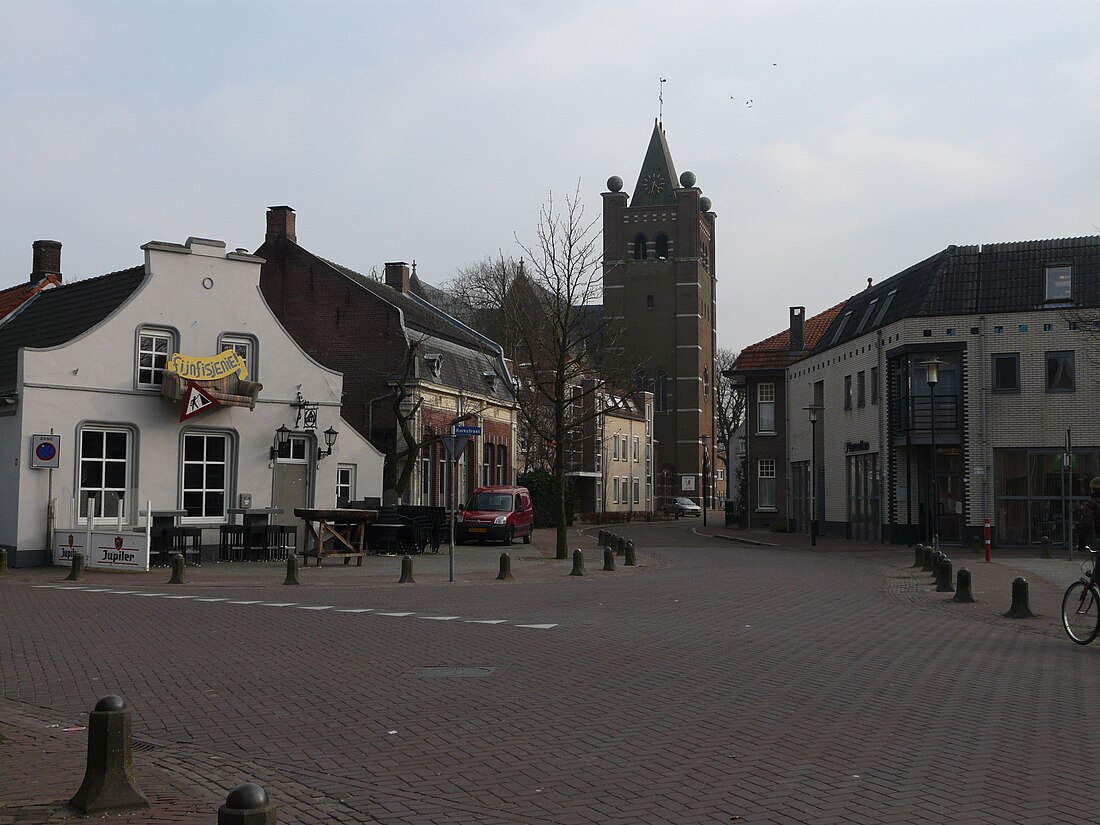
 Square in Gilze | |
 Location in North Brabant | |
| Coordinates: 51°35′N 4°55′E | |
| Country | Netherlands |
| Province | North Brabant |
| Government | |
| • Body | Municipal council |
| • Mayor | Derk Alssema |
| Area | |
| • Total | 65.66 km2 (25.35 sq mi) |
| • Land | 65.38 km2 (25.24 sq mi) |
| • Water | 0.28 km2 (0.11 sq mi) |
| Elevation | 10 m (30 ft) |
| Population (January 2021)[4] | |
| • Total | 26,723 |
| • Density | 409/km2 (1,060/sq mi) |
| Time zone | UTC+1 (CET) |
| • Summer (DST) | UTC+2 (CEST) |
| Postcode | 5120–5126 |
| Area code | 0161 |
| Website | www |
Rijen grew in the 19th century due to its leather factories.[citation needed]
Population centres
- Rijen (population: 16,581)
- Gilze (7,729)
- Molenschot (1,341)
- Hulten (328)
Topography
Dutch Topographic map of the municipality of Gilze en Rijen, June 2015
Transportation
Railway Station: Gilze-Rijen
Climate
The climate in this area has mild differences between highs and lows, and there is adequate rainfall year-round. According to the Köppen Climate Classification system, Gilze en Rijen has a marine west coast climate, abbreviated "Cfb" on climate maps.[5]
On 24 July 2019, temperatures in Gilze en Rijen reached as high as 39.2 °C (102.6 °F), the highest temperature ever recorded in The Netherlands until it was surpassed by Eindhoven the same day.[6][7] However, a day later, on 25 July, temperatures in Gilze en Rijen reached 40.7 °C (105.3 °F), making it the first place ever in The Netherlands where 40 °C (104 °F) was measured and took away the record back from Eindhoven.[8] Climate change was found to be the culprit of such hot temperatures in Netherlands.[9]
| Climate data for Gilze en Rijen (1991−2020 normals, extremes 1951−present) | |||||||||||||
|---|---|---|---|---|---|---|---|---|---|---|---|---|---|
| Month | Jan | Feb | Mar | Apr | May | Jun | Jul | Aug | Sep | Oct | Nov | Dec | Year |
| Record high °C (°F) | 15.2 (59.4) |
19.5 (67.1) |
24.7 (76.5) |
29.1 (84.4) |
33.2 (91.8) |
34.7 (94.5) |
40.7 (105.3) |
36.2 (97.2) |
35.1 (95.2) |
27.2 (81.0) |
20.3 (68.5) |
15.9 (60.6) |
40.7 (105.3) |
| Mean daily maximum °C (°F) | 6.2 (43.2) |
7.3 (45.1) |
10.9 (51.6) |
15.4 (59.7) |
18.9 (66.0) |
21.7 (71.1) |
23.7 (74.7) |
23.5 (74.3) |
19.9 (67.8) |
15.1 (59.2) |
10.0 (50.0) |
6.7 (44.1) |
14.9 (58.8) |
| Daily mean °C (°F) | 3.5 (38.3) |
3.9 (39.0) |
6.6 (43.9) |
9.9 (49.8) |
13.6 (56.5) |
16.4 (61.5) |
18.4 (65.1) |
18.0 (64.4) |
14.8 (58.6) |
11.0 (51.8) |
6.9 (44.4) |
4.1 (39.4) |
10.6 (51.1) |
| Mean daily minimum °C (°F) | 0.4 (32.7) |
0.3 (32.5) |
2.1 (35.8) |
4.1 (39.4) |
7.7 (45.9) |
10.6 (51.1) |
12.8 (55.0) |
12.4 (54.3) |
9.8 (49.6) |
6.8 (44.2) |
3.5 (38.3) |
1.2 (34.2) |
6.0 (42.8) |
| Record low °C (°F) | −19.3 (−2.7) |
−20.2 (−4.4) |
−14.2 (6.4) |
−7.3 (18.9) |
−2.3 (27.9) |
1.5 (34.7) |
3.9 (39.0) |
3.9 (39.0) |
−0.4 (31.3) |
−6.7 (19.9) |
−10.8 (12.6) |
−17.0 (1.4) |
−20.2 (−4.4) |
| Average precipitation mm (inches) | 68.0 (2.68) |
63.1 (2.48) |
54.8 (2.16) |
42.5 (1.67) |
59.8 (2.35) |
66.5 (2.62) |
81.4 (3.20) |
71.6 (2.82) |
65.4 (2.57) |
69.9 (2.75) |
74.2 (2.92) |
81.9 (3.22) |
799.1 (31.46) |
| Average relative humidity (%) | 87.0 | 84.1 | 78.9 | 73.1 | 72.9 | 74.3 | 75.5 | 77.1 | 81.6 | 85.4 | 89.2 | 89.0 | 80.7 |
| Mean monthly sunshine hours | 70.6 | 89.9 | 138.1 | 188.4 | 215.7 | 210.1 | 212.2 | 198.1 | 159.4 | 119.4 | 71.7 | 57.5 | 1,731.1 |
| Percent possible sunshine | 27.0 | 31.8 | 37.4 | 45.4 | 44.6 | 42.3 | 42.5 | 43.7 | 41.9 | 36.0 | 26.7 | 23.5 | 36.9 |
| Source: Royal Netherlands Meteorological Institute[10][11] | |||||||||||||
Notable people

- Marcellin Theeuwes (1936 in Gilze en Rijen – 2019) was a Dutch Carthusian monk
- Jacques Theeuwes (born 1944 in Rijen) a Dutch economist, accountant and academic
- Henriette van Lynden-Leijten (1950 in Gilze en Rijen – 2010) a Dutch Baroness and diplomat to Bulgaria and the Vatican
Sport
- Janus Theeuwes (1886 in Gilze en Rijen – 1975) an archer, gold medallist in the 1920 Summer Olympics
- Joep van den Ouweland (born 1984 in Gilze en Rijen) is a Dutch footballer with over 300 club caps
- Cees Doorakkers (born 1963 in Gilze) a former Grand Prix motorcycle road racer
- Jeroen Blijlevens (born 1971 in Gilze en Rijen) a retired road bicycle racer
See also
Gallery
- Natuurgebied De Duiventoren
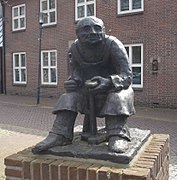
- Gilze en rijen kunstwerk schoenmaker
- Gerardus Majellakerk
- Gilze en rijen kunstwerk margrieten
References
External links
Wikiwand in your browser!
Seamless Wikipedia browsing. On steroids.
Every time you click a link to Wikipedia, Wiktionary or Wikiquote in your browser's search results, it will show the modern Wikiwand interface.
Wikiwand extension is a five stars, simple, with minimum permission required to keep your browsing private, safe and transparent.


